International Business Relations, LLC
Professional Power and NFC Consulting/Engineering/Management since 1991

NU Price Data

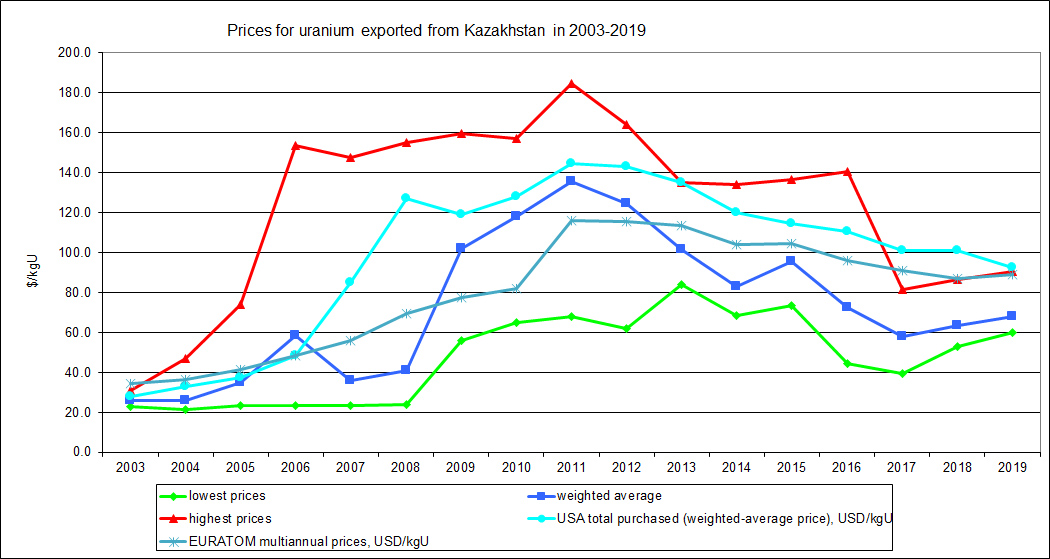
Kazakhstan historical price data for NU (2003-2019)

Year

Lowest prices,

$/kgU

Weighted average,

$/kgU

Highest prices,

$/kgU

USA total purchased (weighted-average price), $/kgU EURATOM multiannual prices, $/kgU
2003 23.0 25.8 31.1 28.1 34.5
2004 21,2 26,18 47,1 32,8 36.2
2005 23.5 35.0 73.9 37.3 41,6
2006 23.5 58.7 153.7 48.4 48.4
2007 23.5 35.78 147.6 85.2 56.1
2008 24.0 41.19 155.1 127.1 69.4
2009 56.2 101,9 159,6 119.2 77.4
2010 64.8 118.0 157.3 128.2 81.8
2011 68.1 135.5 184.7 144.7 116.2
2012 62.0 124,6 164 143,0 115,7
2013 83.87 101.47 135.28 135.17 113.15
2014 68.26 83.06 134.21 120.02 104.05
2015 73.57 95.5 136,48 114.74 104.62
2016 44.60 72.7 140.63 110.3 100.6
2017 39.45 58.0 81.46 100.88 91.02
2018 52.7 63.5 86.4 100.9 87.0
2019 60.1 67.9 90.7 92.5 89.0

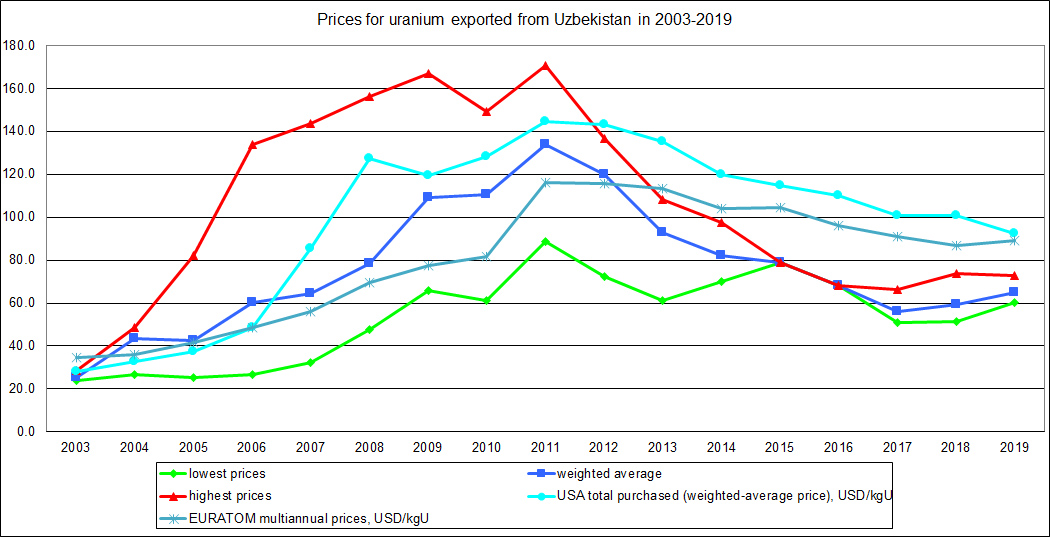
Uzbekistan historical price data for NU (2003-2019)

Year

Lowest prices,

$/kgU

Weighted average,

$/kgU

Highest prices,

$/kgU

USA total purchased (weighted-average price), $/kgU EURATOM multiannual prices, $/kgU
2003 23.7 25.24 28.7 28.1 34.5
2004 26.7 43.24 48.4 32.8 36.2
2005 25.4 42.5 81.9 37.3 41.6
2006 26.5 60.2 133.9 48.4 48.4
2007 32.5 64.3 143.6 85.2 56.1
2008 47.6 78.2 156.4 127.1 69.4
2009 65.8 109. 166,8 119.2 77.4
2010 61.0 110,6 149.4 128.2 81.8
2011 88.6 133.9 170.6 144.7 116.2
2012 72.2 119.8 136.4 143.0 115.7
2013 61.1 92.9 108.4 135.17 113.15
2014 69.9 82.09 97.4 120.02 104.05
2015 79 79 79 114.74 104.62
2016 68 68 68 110,3 100.6
2017 50.7 56.1 66.3 100.88 91.02
2018 51.4 59.2 73.6 100.9 87.0
2019 60.2 65.1 73.0 92.5 89.0

IBR's uranium prices  is provided as a subscription to its clients of specific services. Any information provided on this website is done so as a courtesy to the public.


E-mail: info@ibr.ru, info@ibreu.eu

Write us